
Create an ABM Focused Home Page
One way to give your sales team an overview of their target accounts is to create and display List Views, Reports and Dashboards on a Home Page or an App Page. Since Home Pages currently offer more Standard Lightning Components, including AI powered Assistant, they have the slight edge over App Pages. App Pages have more standard templates, allowing a variety of layouts, whereas Home Pages offer only one standard layout template.
 Use Assistant on Your Home Page
The Assistant Component available on Home Pages monitors a wide variety of data points within Salesforce, related to the User. To date, these include:
- Leads assigned to you today
- Opportunities with overdue tasks
- Opportunities with no activity in 30 days
- Opportunities with no open activity
- Opportunities with velocity changes
- Overdue opportunities (open after Close Date)
- Email sentiment and perceived impact on Opportunities
If you are an Einstein AI customer, for example an Einstein Sales AI customer like OpFocus, the Assistant Component on the Home Tab upgrades itself to be Einstein Insights. Per Salesforce Help “On the Home page, Einstein users see insights based on the accounts they own, follow, and are an account team member of. A user’s manager also has access to these insights.”  Einstein Insights adds data to the Assistant on:
- Account Leadership Changes
- Account M&A Activities
- Account Activity and Email Sentiment analysis
The best part is that your Users can “tune” the Assistant what is relevant or correct by clicking on the down arrow to the right of each insight and selecting a feedback. This feature seems to get better and better.
Create a My Target Accounts List View
In Account Based Marketing ABM on Salesforce Part 1, we created a Custom Field of type Checkbox called ‘Target Account’, and will now use it to create a List View ‘My Target Accounts.’ List Views are sortable by a single column and allow for in-line editing of a single or multiple records. If we’ve brought in data from external systems, such as SaaS utilization data, we might look to “roll up” data to the associated parent account and display that here along with other key fields. 
 Create a Report with Funnel Chart of ABM Engagement
If you create a picklist field to track ABM Engagement, you can create a Report filtering on My Target Accounts and display a Funnel Chart. Much like an Opportunity funnel, the ABM funnel can drive behavior and focus toward driving Account relationships. This can easily be dropped on to a Dashboard or directly on to your Home Page.
Create Custom Report Types
Custom Report Types are data structures that Users can use to create Reports. A special capability they offer is the ability to create Left Outer Joins. This is a database term meaning a connection between two tables (Objects in Salesforce speak) which support a with or without relationship between the two tables. A System Administrator, or a User’s whose Profile allows them to, can create Custom Report Types. Three that I suggest creating in support of your ABM on Salesforce initiative include: 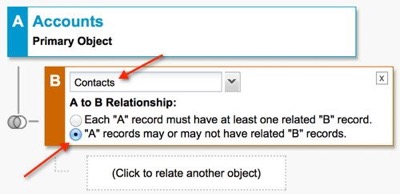
- Accounts with or without Opportunities
- Accounts with or without Activities
- Accounts with or without Contacts
For an overview of how to create Custom Report Types, check out 5 Great Salesforce Custom Report Type Examples & How to Create Them.
Create a Dashboard Table on My Target Accounts and Their Open Pipeline
Using the Custom Report Type ‘Accounts with or without Opportunities’, create a Report showing My Target Accounts and their Open Pipeline. This can be used in a few ways. You might display a Dashboard Table listing all Account Names and their corresponding open Opportunities (as displayed below). We can put a Dashboard on any page in Salesforce Lightning, and because of this we can think of a Dashboard as another means of formatting information. You might show a Horizontal Bar Chart displaying the Amounts by Account. Because of the underlying Custom Report Type, this will dutifully show all Accounts, even ones that don’t have an Opportunity. 
Create a Report on My Target Accounts with or without Activities
Similar to above, you might show a list of Accounts and their related Activity counts over the past 30 days. If your team is focused on certain kinds of Activities, such as Cold Call, Connect, Demo, etc, you’ll want to make it very easy for Reps to record them. I wrote about this in Part 1 of this ABM on Salesforce article. Once your Users know how to log their Activities, you can report on them.
Use the Home Page to Display Progress on ABM
Because we now have the ability to embed Dashboards on any Page Layout in Lightning, we can combine Report output components into one Dashboard to create consolidated views of ABM data. 
Use Kanban List View to Quickly View & Update ABM Status
Finally, Kanban List View is available on Accounts! We can take a simple List View and jazz it up to display our ABM Engagement. We might ask a system administrator to create a Roll Up Summary showing Total Amount of Open Opportunities. Then we can sum that on the Kanban and display a Chart showing the amounts. Salesforce intended Kanban for quickly making updates, literally by dragging them from one column to another. Consequently the system recalculates the open pipeline amount sums in real time!  What other ideas and suggestions do you have? Please use the Comments section to share ideas.